Monday, April 23, 2018

Kahoot

Kahoot is very similar to Socrative as a free online assessment tool - just that the element of gaming is stronger as the player is given a score based on accuracy and speed. As there are more students who own smart phones nowadays, using Kahoot to do a quick check on understanding with the element of game will definitely engage the students.

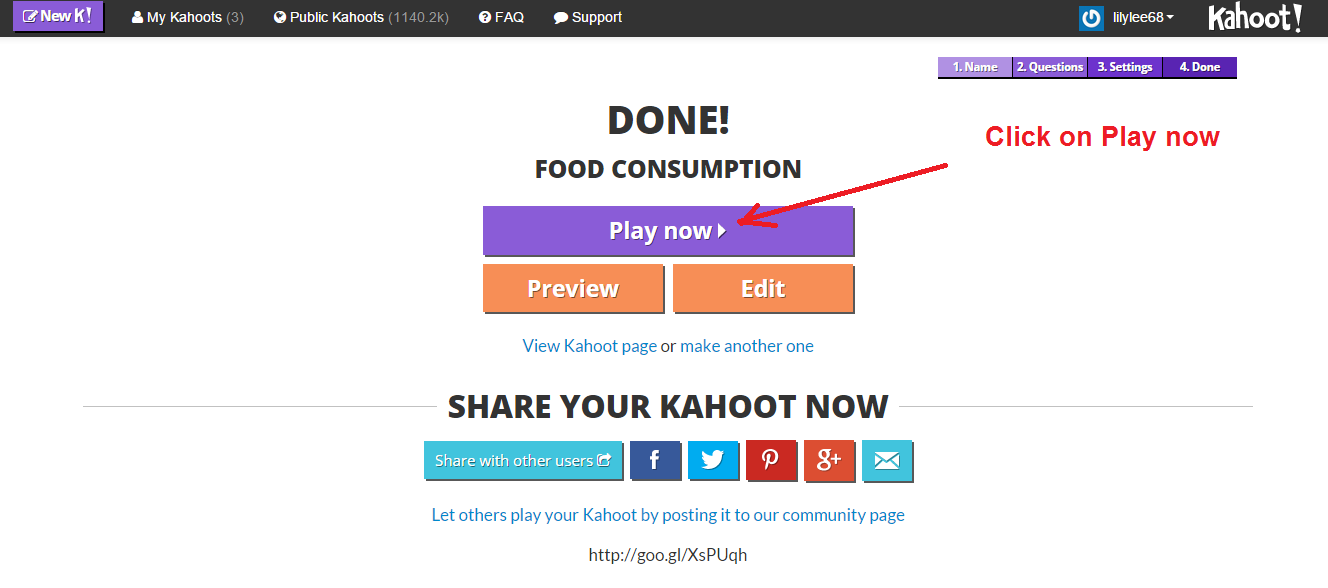
It is very easy to create the quiz. Just login to https://create.kahoot.it/ You can also create discussion or survey as shown below.


The following screen shoot shows what the students will see on his/her handphone.


The score is updated after every question!


 The winner is announced!


To launch the quiz again just login to https://create.kahoot.it/


You can also preview the game first.


After the game is played you can download the results in Excel format for analysis. 

Kahoot has just introduced a new feature ‘Ghost mode’. 
After you finished a game of Kahoot! you will see a new ‘Play again’ button that also contains a ghost icon. 
When you click on the button, the same game is relaunched. As well as your ‘live’ class, all players are joined by their ‘ghosts’! The ghosts play the game alongside live players, and their answers (and answer times) will be exactly the same as those the players entered in the previous game.


Ghost mode is a great way to encourage the students to compete against themselves as well as each other. It gives the students a chance to beat their previous score and provides immediate feedback.


I have some of the kahoot in Ghost mode on the links below.
https://sites.google.com/a/moe.edu.sg/sec3geog/kahoot---revision-quiz
The students can be given the link to the ghost mode and practice at their own pace.


You can search in the Public Kahoot. To locate and duplicate the one I have created, search for lilylee68.

Or you can access the following links

Food: https://play.kahoot.it/#/k/1209bd54-4852-4396-b49e-91f1460c7d55

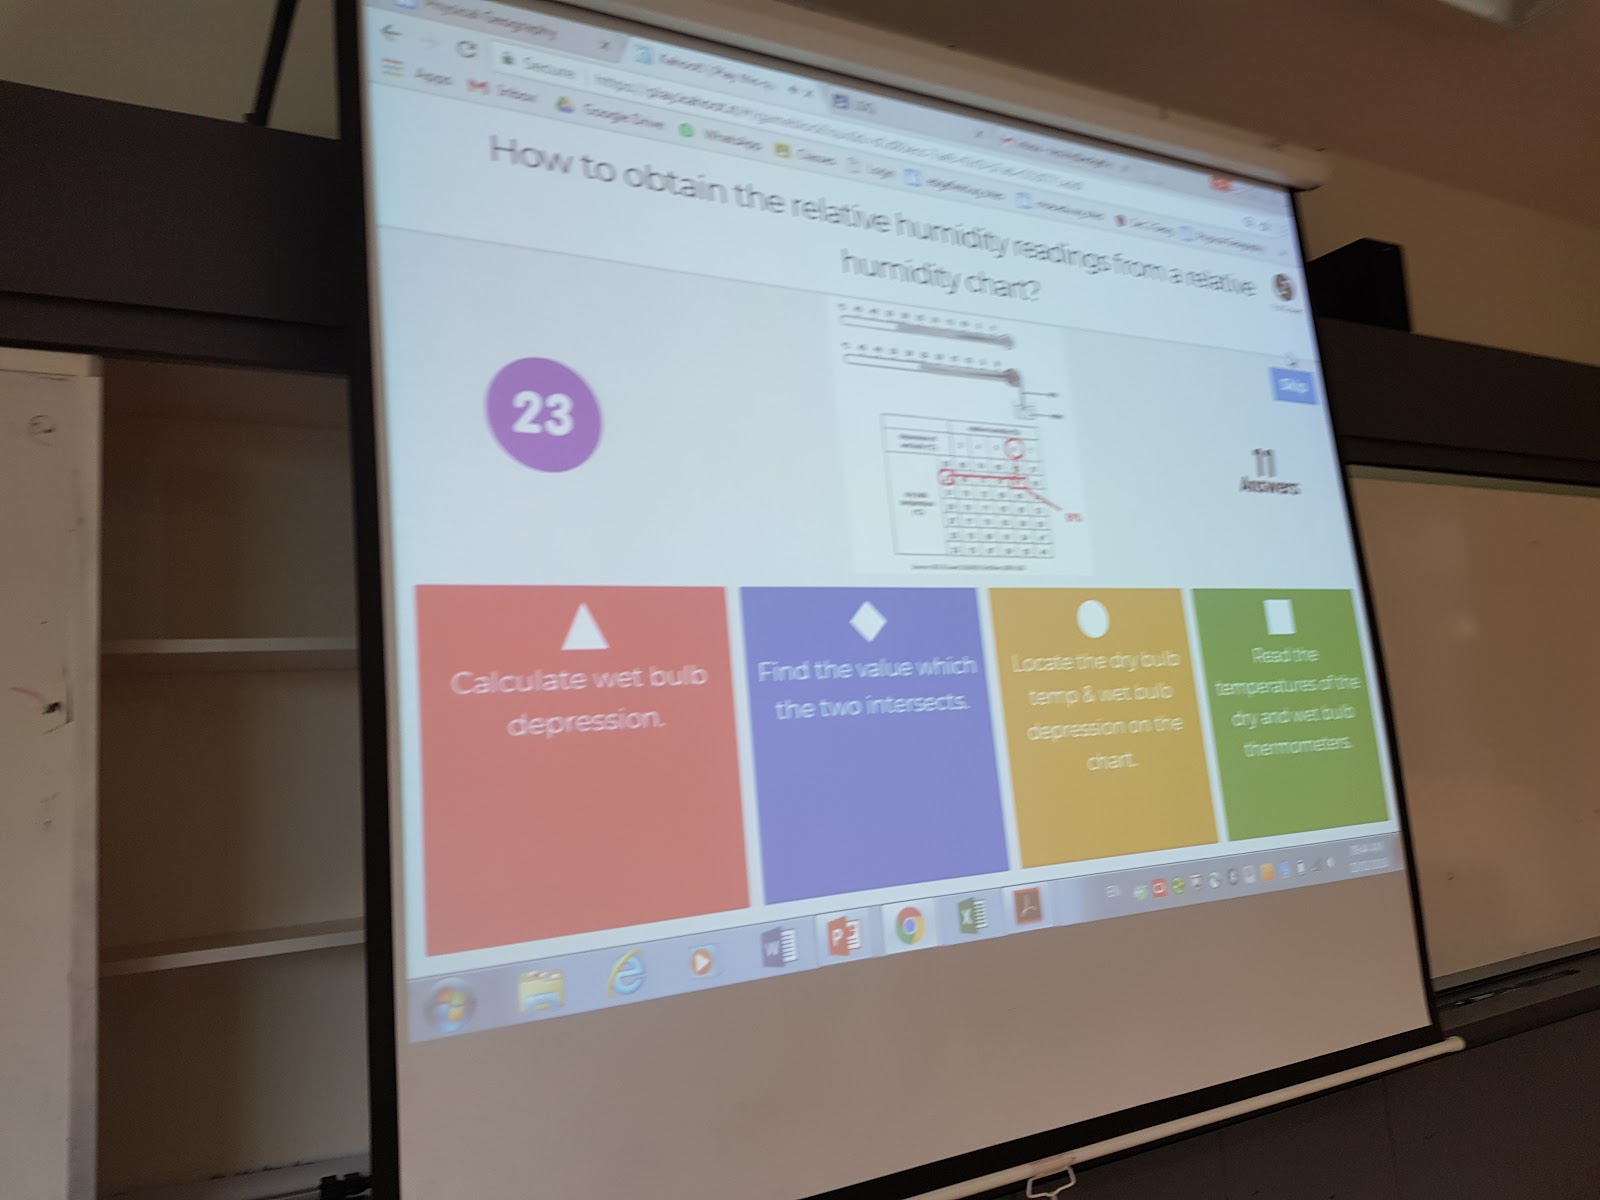
Temperature: https://play.kahoot.it/#/k/b733b365-5152-473d-b7c7-9ccc7a6be7fb There is a new game format in Kahoot - Jumble. This is good for questions which require sequence of steps. I did one on weather instrument - you can try it -

A new feature on Kahoot is Jumble.
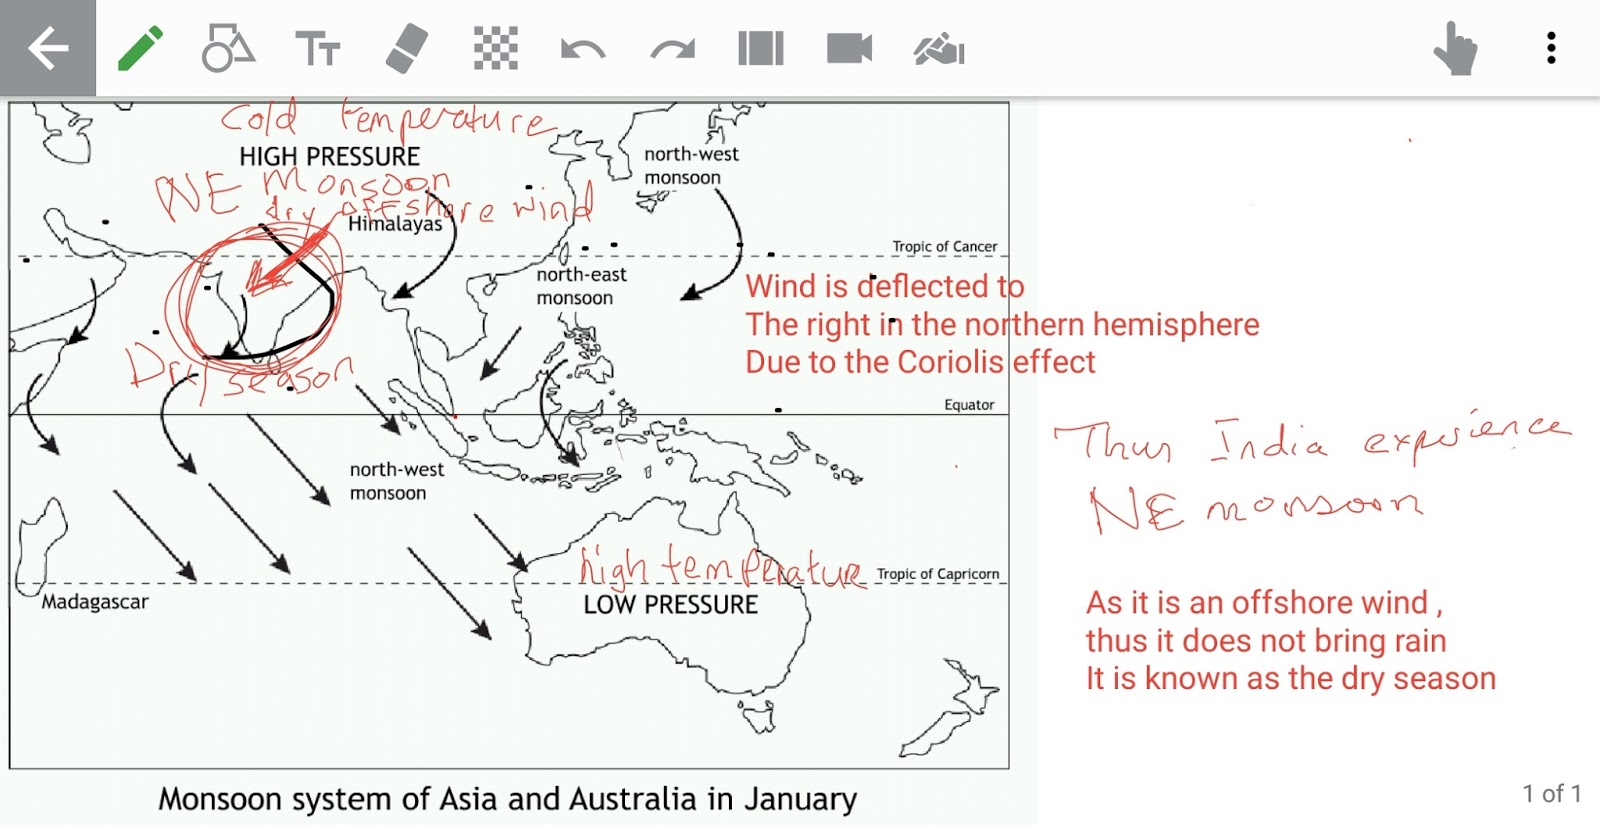
The following is a screenshot of what the students will see on their mobile/ipad/tablet. They can drag the answer and place them in the correct sequence by looking at the projection on the teacher's screen.
Student's mobile


Teacher's screen


Limitation: However it's kind of being limited by only 4 steps and no. of words for each step.

Opportunity - can use for Chinese idioms which is four letter words - clue is given and then make them to reorder the 4 letters to form the idiom. Tried out and confirmed that Chinese inputs are accepted. But the Chinese word is a bit small.

It definitely can be used in Science for steps in experiment or steps to work a Math solution. Steps for cooking. Sequence of events or dynasty etc in History etc. 

All the kahoot on Geography I have generated for revision is on the google site.  Another plus point of using Kahoot as you can save the links and use it with the class anytime.
Physical geog - https://sites.google.com/a/moe.edu.sg/sec3geog/kahoot---revision-quiz
Human geog - https://sites.google.com/a/moe.edu.sg/sec-4-geography/kahoot-quiz

If you do use it, do save the results so that you can analyse them later and clarify with the class on questions which majority got it wrong.

I have also used Kahoot to motivate students to read up before the lessons so that they can try it at the start of the lesson and then clarify the main points of the topic.
You can read all my posts on Kahoot : http://ezitnew.blogspot.sg/search/label/kahoot


Another new feature on Kahoot is that you can assign it as homework. Students can play the challenges in their own time and get instant feedback. 
However the students can only run it on the kahoot app so they need to download it.


You can share the link and pin in the Google classroom, via email or even WhatsApp. I normally give them a 3 day window for the challenge. You can then get the results by clicking on the Kahoot you have assigned as homework and then click on the challenge followed by the leadership board. Make sure you are signed in to your account.


Click on the top menu on questions to see the results of individual question.

What I like most is that by analysing the results, I could see the questions which the students are weakest in and I could then clarify in class e.g. students are still weak in wave refraction and impacts on headland and bay.


I was rather surprised that there are students who cannot identify a sea arch. This is definitely something which the challenge help me to see parts which I have assumed that the students already knew.

Again my reservation on using this is that no all have smart phone which they need to download the app. But overtime as smartphone or even iPad are available to all, this should not be an issue then.

You can read all my posts on Kahoot : http://ezitnew.blogspot.sg/search/label/kahoot

Liveboard

Exploring the affordance of the liveboard app. It looks very promising with the ability to collaborate real time, either online or even without data with people nearby. 

Watch this video on the liveboard app:


I like the fact that I can annotate on the pictures taken and then shared instantly and the students collaborate with team members in analysing the data.  Digitising the task of annotating pictures or fieldsketch will make it easier for the students to work collaboratively in make amendment and addition together.

It can also record and share what is written on the screen.

Usage is simple. You can download the app via playstore or apple store. Just sign up for the account upon login.  Most importantly - it is free!


It can also be shared on browser (chrome) except that the recording function will not be there - https://app.liveboard.online/


Tried it out with a small group today in explaining a lesson and realised that it is a good tool for remote teaching too. 2 students from 2 diff classes needed explanation on how monsoon affect India's climate thus I told them to download and showed them using the liveboard. from home. They clarified their doubts using the chat function. So it is useful in explaining to small groups online real time.
Usage is simple too. Just start the session and invite them with the code which can be sent via WhatsApp.


The chat window is on the right hand side which made it easier to clarify any doubts the students have.


The girl find it useful as she could record the session as well.
The boy was struggling and keep erasing instead of adding to the map.


The session can be saved as shown under recording as shown above.
The following is a recording of how I explained the formation and differences between stratovolcano and shield volcano to a student during a live tutorial.


As feedback by the student it is a good app as he can converse and clarify with the teacher or collaborate with other students on an idea and able to retrieve the information even after the session has ended.

The various tools on the whiteboard as shown above. I have inserted the picture first and then annotated the picture to explain to the students.  You can also add participants by sending them the code. 


If you are conducting a tutorial and just want to show the steps without the participants drawing on it, you can disable all drawings by clicking on user. However this function is only available on the app and not on browser version.

The liveboard on Chrome. https://app.liveboard.online/


Saturday, April 14, 2018

Coastal studies at ECP

Carried out the coastal studies with one group of students (40) in 2016 and 2 groups of students in 2018 - 28 on 7 April 2018 and 29 on 14 April 2018

Fieldwork Procedure for Field Site A  Activity 1
ACTIVITY 1: How does the wind direction and wind speed affect the movement of sediments?    
FIELD SITE A:  Between Breakwater 4 and 5


Equipment 
• Float (an orange) use to represent beach materials 
• Ranging Poles
Resource pack containing 1.Weather tracker 2. clinometer 3. stopwatch 4. tally-counter 5. measuring tape
• Compass (with phone app)

Procedure 
1. Briefly describe the weather conditions (wind, temperature, rainfall, etc.) 
2. Sketch the coastline observed at Site A in Fig. 1 of your handout. 
3. Observe and record the following in Fig 1: 
     a. compass north  
     b. wind and wave direction 
4. Use the equipment provided and describe how your group went about collecting the data and explain the chosen procedure.
5. Observe the drifting of the beach materials and what happens when it meets the groyne. You can record your observations in written form, video or oral recording. 
6. Record the wave frequency for 5 minutes using the stopwatch and T-counter app. Calculate the wave frequency per min by dividing the total count by 5.

Fieldwork Procedure for Field Site B   Activity 2
ACTIVITY 2: What happens to the movement of beach materials when there is/are human management structures (breakwaters)? 


FIELD SITE B:  Beach area next to Breakwater 5 in front of bicycle rental shop

Equipment 
• Measuring tape
• Ranging Poles
• Resource pack containing 1.Weather tracker 2. clinometer 3. stopwatch 4. tally-counter 5. measuring tape
• Clinometer (with phone app)

Procedure:
1. Briefly describe the weather conditions (wind, temperature, rainfall, etc.) 
2. Sketch the coastline observed at Sites B1 or B2 in Fig. 2.  
3. Observe and record the following in Fig 2: a. compass north  b. wind and wave direction   
4. Use the equipment provided and describes how your group went about collecting the data and explain the chosen procedure. 
5. Using the measuring tape and clinometer, construct the beach profile.
6. Measure the gradient on both sides of the breakwater using the clinometer app.


Fieldwork Procedure for Field Site C ( Activities 3 and 4)   
FIELD SITE C: Pavilion on the beach in front of the bicycle rental shop

Activity 3: Interview 
Interview at least 5 persons at the park.  

Activity 4: Bipolar Evaluation 
Evaluate the human management structure – groyne and breakwaters using the bipolar evaluation form. 


More Photos from fieldwork 9 April 2016 : https://mobile.facebook.com/lilylee.68/albums/10153664632704200/


More photos from fieldwork 14 April here https://m.facebook.com/lilylee.68/albums/10155673514039200/?ref=bookmarks

Tuesday, April 10, 2018

Google Earth

Sharing on Google Earth again though you can still refer to my earlier posts on how you can use it for Geography - http://geogshare.blogspot.sg/search/label/Google%20Earth
Google Earth is very useful to show authentic learning to students as well as to illustrate the concepts of place and space to the students.

I hope that it is sustained as I did one activity with the students on weather - the influence of latitude, altitude and distance from the sea on temperature in 2016. I was pretty upset when they remove the temperature layer from Google Earth - wasted my effort in designing the worksheet but at least that batch of students benefitted (Sec 3 Pure Geog 2016)

Sharing on how I use Google Earth for my lesson on Volcano:
I have place mark   two volcanoes  to show the relief of stratovolcano and shield volcano  with reference to the 2015 Geography Elective Paper on  the comparison of Mt Mayon and Prestahnukur.With Google Earth I will also be able to show the plates which cause their formation.

I have also placemark a few volcanoes to illustrate the benefits and risks of living near volcanoes
Nevado del Ruiz  eruption in 1985 (as mentioned in the notes and textbook -• The eruption of Nevado del Ruiz in the Andes mountains of South America in 1985 released a pyroclastic flow. The mixing of pyroclasts and glacial ice along its path triggered lahars which engulfed the town of Armero and killed more than 20,000 people)


the eruption of Eyjafjallajokull in Iceland in 2010 produced extensive volcanic ash clouds that posed danger to aircraft engines an structures.The eruption resulted in a closure of air space over much of Europe, causing delays to 1.2 million passengers daily and costing the airline industry a total of US$1.8 billion.

Mt Merapi  - where many are involved in agriculture due to the rich volcanic soil so despite the risks many still return https://www.voanews.com/a/economic-life-slowly-returns-to-indonesias-mount-merapi--137062538/168354.html

Kimberley in South Africa are one of the world’s richest sources of diamond.

I would also highlight  the location of the volcanoes e.g. ring of fire (oceanic-continental convergent), Mariana Islands (oceanic-oceanic convergent), Mid-Atlantic (oceanic-oceanic divergent), along the Great East African Rift Valley (Continental-continental divergent)

You can download the volcano kmz file here:
https://sites.google.com/a/moe.edu.sg/sec3geog/google-earth/earthquake%20focus.kmz?attredirects=0&d=1
Of course you can also refer to the worksheet and kmz file which I have used for the students to explore the different types of plate boundaries as well as the features and landforms found at the respective plate boundaries:
Plate Boundaries Worksheet - https://sites.google.com/a/moe.edu.sg/sec3geog/google-earth/Google%20Earth%20Tectonic%20Plates.docx?attredirects=0&d=1
Plate Boundaries kmz file  https://sites.google.com/a/moe.edu.sg/sec3geog/google-earth/Earths%20Tectonic%20Plates.kmz?attredirects=0&d=1


A very good Google Earth resource site
https://resources.mrpiercey.com/geo-tools/google-earth